OpenWrt Monitoring with Prometheus & Grafana
Overview
OpenWrt does not run the standard Go node-exporter by default. Instead, it provides a Lua-based exporter that:
- Is extremely lightweight (router-friendly)
- Uses its own
uhttpdinstance - Exposes Prometheus metrics over HTTP (commonly on port
9100) - Supports system, network, and WiFi client metrics
Installation
# ssh into your OpenWRT router
ssh root@192.168.1.1

# Run the below commands
opkg update

opkg install \
    prometheus-node-exporter-lua \
    prometheus-node-exporter-lua-nat_traffic \
    prometheus-node-exporter-lua-netstat \
    prometheus-node-exporter-lua-openwrt \
    prometheus-node-exporter-lua-wifi \
    prometheus-node-exporter-lua-wifi_stations
Exporter Runtime Model
The exporter runs its own uHTTPd process (not the main LuCI one).
Example process:
This means:
- Metrics are served at
/metrics - Port 9100 is valid (unlike the LuCI-based exporter mode)
Configurations
By default, the exporter may bind to the wrong interface IP (e.g. old LAN IP) if you had configured custom vLANs on your router.
Modifying Interfaces & Ports
Make sure the below configs configs are changed so that metrics endpoints are exposed in your right interfaces where the K8s have access to.
Edit:
Set:
config prometheus-node-exporter-lua 'main'
        option listen_address '0.0.0.0'
        option listen_port '9100'
Restart:
Verify:
Expected:
Verify Metrics Endpoint
From the router:
From another machine:
Prometheus Operator Integration
If you are already running the Prometheus stack with Grafana in K8s like me, you can use the ScrapeConfig CRD which operator porvides.
---
apiVersion: monitoring.coreos.com/v1alpha1
kind: ScrapeConfig
metadata:
  name: openwrt-router
  namespace: monitoring
  labels:
    release: prometheus
spec:
  jobName: OpenWRT
  metricsPath: /metrics
  scrapeInterval: 15s
  staticConfigs:
    - targets:
      - "192.168.1.1:9100"
Grafana Dashboard
Below dashboard provides quite a few insights about the router, network & other useful metrics.
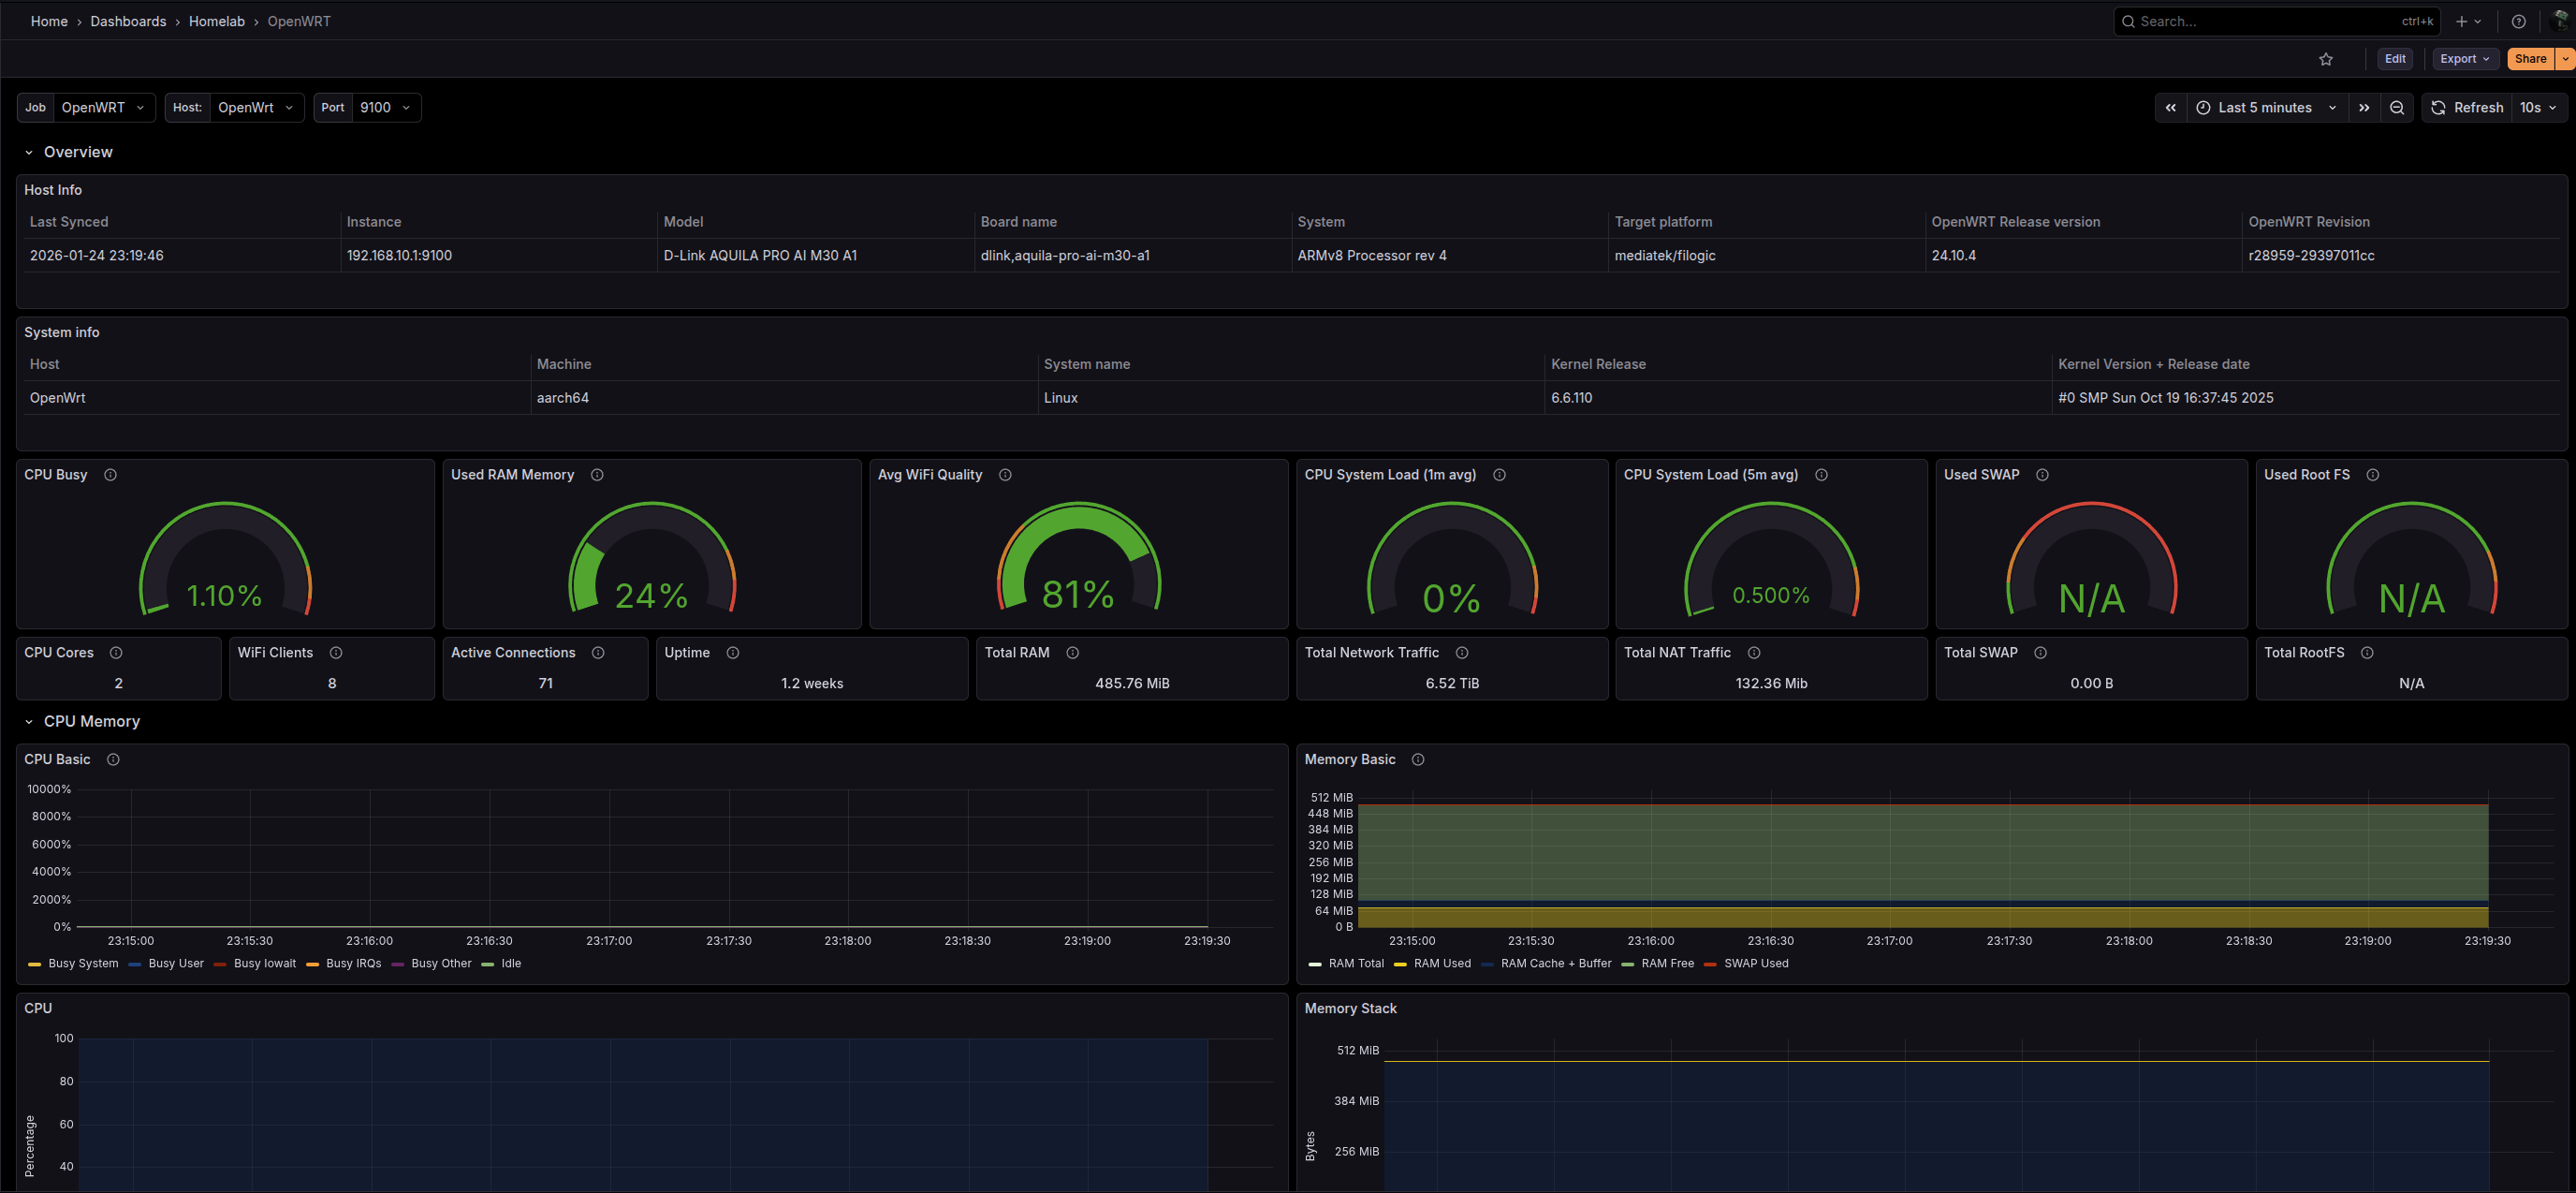
Dashboard link here. You can install the dashboard using the GrafanaDashboard Grafana operator CRD in K8s.
---
apiVersion: grafana.integreatly.org/v1beta1
kind: GrafanaDashboard
metadata:
  name: opennwrt
  namespace: monitoring
spec:
  resyncPeriod: 12h
  instanceSelector:
    matchLabels:
      grafana.internal/instance: grafana
  datasources:
    - datasourceName: prometheus
      inputName: DS_PROMETHEUS
  url: "https://grafana.com/api/dashboards/18153/revisions/4/download"